
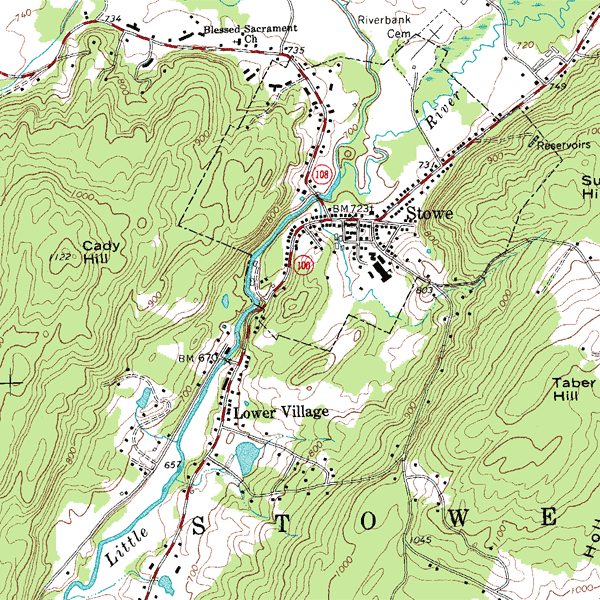
Marching Squares in action.
It's not often that I write about algorithms due to the simple truth that there is a plethora of blog posts, tutorials, and other such content dedicated to each and every one. Unfortunately, while working out how to program Marching Squares, I was greeted by stale links and a less than clear Wikipedia page. Not only that, most implementations I found read like barely translated photocopies of C++ code right down to the bitshifts.
This problem has prompted me to write this post. Although bit shifts and binary lookup tables are perfectly valid approaches, these low-level concepts don't fit the high-level languages they are being used in and work to obfuscate the simplistic workings of Marching Squares.
Example of Contours from Wikipedia
Marching Squares is an algorithm based on Marching Cubes typically used to generate contours (Isolines or Isobands) from height, pressure, or other similarly formatted data. Isolines are the contours you would see on a topographical map. An Isoband refers to the filled areas within the bounds of an isoline. Within this tutorial, we shall only be covering Isolines. For simplicities sake, rather than actual height maps, simplex noise scaled to be within the range 0 - 1 will be used in their place.
What we'll be doing
Our first steps will be to explain and implement a basic version of the algorithm that successfully draws one isoline at a specific threshold. From there, we'll be taking steps to implement a version of Marching Squares that can draw n isolines for n thresholds.
Within this tutorial, we will be using TypeScript, a noise library, and the canvas API. I've tried to keep my TypeScript types to a point where it assists understanding. Despite this, I understand the syntax may be unfamiliar to some and hope it doesn't detract from the overall experience.
Understanding the algorithm
The image below represents an n x n grid of points spaced out for understandability. To generate this image, we iterate over the grid, marking the positions with a value greater than or equal to the threshold with a 2 x 2 green circle.

Points on grid above 0.7 threshold
When you view the image above, you can intuitively draw an isoline around the thresholded green points, disambiguating them from the black background. The boundary points to us are clear, but Marching Squares finds the boundary points by first dividing the grid into 2 x 2 squares. We then examine the corners of these squares to discover if they are above or equal to the threshold.
If we find between 1 - 3 points above the threshold, we draw a line in a pre-specified direction between midpoints of the edges of a corner. This line joins with the others to form the isoline for this threshold on the grid.
As we are taking a 2 x 2 sample, and there are 4 points with two states each (above or below threshold), we have 16 possible combinations of those states to consider when deciding how to draw the boundary.

The above image displays all the possible cases and the orientation of the resulting lines in each situation. Although there is a daunting number to handle, we can break this down into three sets. The set which needs no line (4 above or below), the set where a line is drawn based on one corner (only one point above or one below), and the ambiguous case where a line is drawn based on the relation of two corners.

In plain English, Marching Squares iterates over a n x n grid, gets a 2 x 2 square of points at each position, checks which pre-defined case it matches, then draws the pre-defined line. With all this in mind, we shall get to implementing the algorithm.
Implementing the Algorithm
The first, and simplest step, is to initialise the grid. This code is written in what will hopefully be unobtrusive typescript. It's a tendency amongst TypeScript developers to display their command of the language and secure their job by utilising a complex indecipherable mass of generics that can only be understood by the initiated.
In this early example, the types are clear and appended after the variable. For the function signature const generateGrid = (width: number, height: number): number[][] = > {}; the types appear after the variable names (width, height) and start of the arrow function. All types, where used, are preceded by colons.
These types instruct us that both width and height variables are numbers (: number) and from this arrow function, we shall return a 2-dimensional array filled with numbers (: number[][]). All typings presented later on will be in a similar format. If you wish to convert it into plain JavaScript, all that is necessary is to remove these typings.
generateGrid.ts
import { createNoise2D } from 'simplex-noise';

const OFFSET = 512;
const SCALE = 0.05;
const noise = createNoise2D();

const scale = (val: number, src: [number, number], dst: [number, number]): number => (
  ((val - src[0]) / (src[1] - src[0])) * (dst[1] - dst[0]) + dst[0]
);

const generateGrid = (
  width: number,
  height: number,
  noise: NoiseFunction2D,
  offset = OFFSET,
  scaling = SCALE,
): number[][] => {
  const grid: number[][] = [];

  for (let x = 0; x < width; x += 1) {
    const row: number[] = [];
    for (let y = 0; y < height; y += 1) {
      row.push(scale((noise(offset + x * scaling, offset + y * scaling)), [-1, 1], [0, 1]));
    }
    grid.push(row);
  }

  return grid;
};
Now, the above code generates a 2d-array filled with numbers pulled from a noise function. The only features of this that require explanation are the two constant variables: scale, and offset. The offset is a number added to the x or y dimension to change the position of the noise. The scale parameter shrinks this position and has the effect of causing the values from the noise function to be more granular, giving us better bumps and features for us to draw contours around.
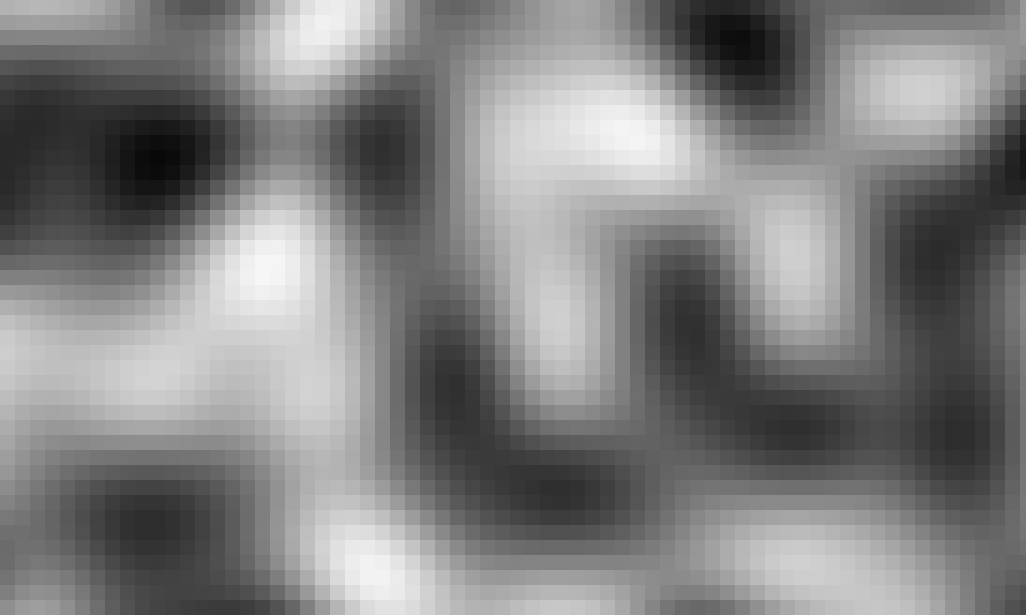
Noise Visualisation
The image above is a grayscale visualisation of the output of the grid generation code. The lighter areas correspond to noise values nearer to 1, and the darker areas for those noise values closer to 0.
Now, this is where our approach starts to differ from the textbook approach built around bit-based lookup tables.
The midpoints for either the vertical or horizontal edge from a corner can be calculated knowing only the (x,y) coordinates of the corner and the (x,y) coordinates of the edge. By structuring the square as an array of four corner objects storing its position, and what other corners it is connected to, you can treat each corner of the square as independent of the others.
We can exploit this property by tracking which corners are above or below the threshold and separating them into two different arrays: above and below.
Due to this, we can solve 8 of the 16 cases with a simple 4-line if statement. For 6 of the remaining, where two corners are above the threshold, we can resolve them by testing whether the two active corners have the same x or y coordinate, or differ in both dimensions. Finally, in the two cases where all are above or below, we do nothing as they do not need a line.
marchingSquares.ts
const SPACE = 15;
const green = '#0BDA51';
// Our types built up from individual sub-types.
export type Vertex = [number, number];

type Corner = {
  pos: Vertex,
  vEdge: Vertex,
  hEdge: Vertex,
};

type Square = [Corner, Corner, Corner, Corner];

const line = (
  point1: Vertex,
  point2: Vertex,
  ctx: CanvasRenderingContext2D,
  colour = green,
  space = SPACE,
) => {
  const [x1, y1] = point1;
  const [x2, y2] = point2;
  ctx.beginPath();
  ctx.moveTo(x1 * space, y1 * space);
  ctx.lineTo(x2 * space, y2 * space);
  ctx.save();
  ctx.strokeStyle = colour;
  ctx.stroke();
  ctx.restore();
  ctx.closePath();
};

const midPoint = (start: Vertex, end: Vertex): Vertex => {
  const [x1, y1] = start;
  const [x2, y2] = end;
  return [x1 + ((x2 - x1) / 2), y1 + ((y2 - y1) / 2)];
};

const getCorners = (x: number, y: number): Square => {
  //  A_______B
  //  |       |
  //  |       |
  //  |_______|
  //  D       C
  const A: Vertex = [x, y];
  const B: Vertex = [x + 1, y];
  const C: Vertex = [x + 1, y + 1];
  const D: Vertex = [x, y + 1];

  return [
    { pos: A, vEdge: D, hEdge: B },
    { pos: B, vEdge: C, hEdge: A },
    { pos: C, vEdge: B, hEdge: D },
    { pos: D, vEdge: A, hEdge: C },
  ];
};

const marchingSquares = (grid: number[][], threshold: number, ctx: CanvasRenderingContext2D) => {
  for (let x = 0; x < grid.length - 1; x += 1) {
    for (let y = 0; y < grid[x].length - 1; y += 1) {
      const corners: Corner[] = getCorners(x, y);
      const above: Corner[] = [];
      const below: Corner[] = [];

      corners.forEach((corner) => {
        const [x1, y1] = corner.pos;
        if (grid[x1][y1] >= threshold) {
          above.push(corner);
        } else {
          below.push(corner);
        }
      });

      // Case 0 & 15
      // We don't draw a line at all for these therefore no action required.
      // Cases 1, 2, 4, 7, 8, 11, 13, 14.
      // Draw line between both horizontal + vertical midpoints
      if (above.length === 1 || below.length === 1) {
        const corner = above.length === 1 ? above[0] : below[0];
        line(midPoint(corner.pos, corner.vEdge), midPoint(corner.pos, corner.hEdge), ctx);
      }

      if (above.length === 2) {
        const [corner1, corner2] = above;
        const [x1, y1] = corner1.pos;
        const [x2, y2] = corner2.pos;

        if (x1 === x2 && y1 !== y2) {
          // Cases 6 & 9
          // Points horizontally aligned, draw vertical line between horiz mid points.
          line(midPoint([x1, y1], corner1.hEdge), midPoint([x2, y2], corner2.hEdge), ctx);
        } else if (x1 !== x2 && y1 === y2) {
          // Cases 3 & 12
          // Points vertically aligned, draw horizontal line between horiz mid points.
          line(midPoint([x1, y1], corner1.vEdge), midPoint([x2, y2], corner2.vEdge), ctx);
        } else if (x1 !== x2 && y1 !== y2) {
          // Cases 5 & 10
          // Points at a diagonal, draw line between both horizontal + vertical midpoints for both
          line(midPoint([x1, y1], corner1.hEdge), midPoint([x2, y2], corner2.vEdge), ctx);
          line(midPoint([x1, y1], corner1.vEdge), midPoint([x2, y2], corner2.hEdge), ctx);
        }
      }
    }
  }
};
Now that you've seen the code, it's time to see it in action.
Improvements
We have our basic version complete, but that means it's time to build a more advanced version. In this part of the tutorial, we'll improve our results by introducing lerp for calculating the midpoints. Following that, we will generalise our code and draw multiple lines at multiple thresholds.
First, our calculation of where to draw the line is simple and based wholly on midpoints, leaving us with a 1980s-style contour map built on strict 45 and 90-degree angles. There is another, far smoother way of calculating these midpoints based on linear interpolation.
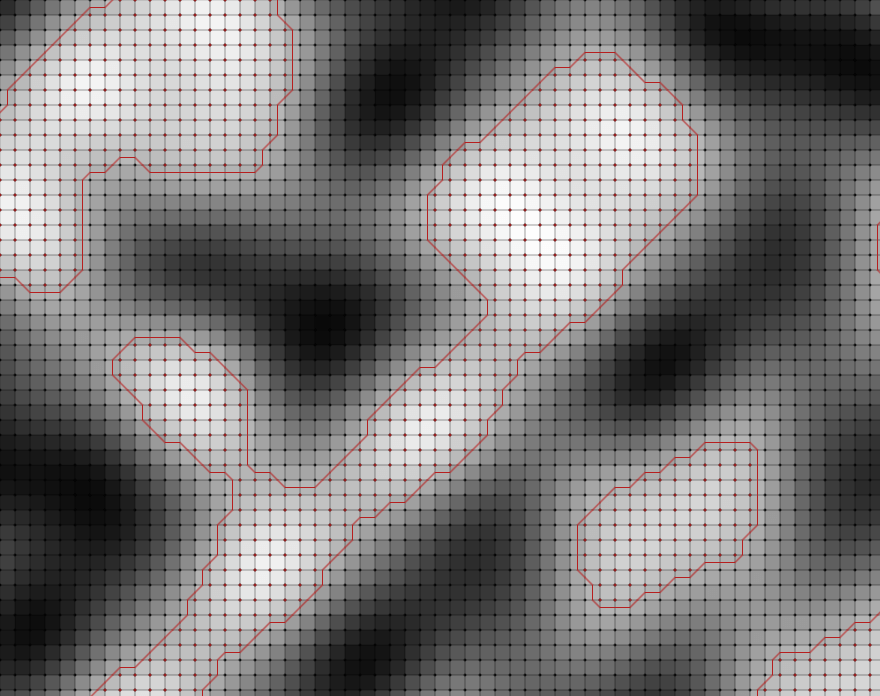
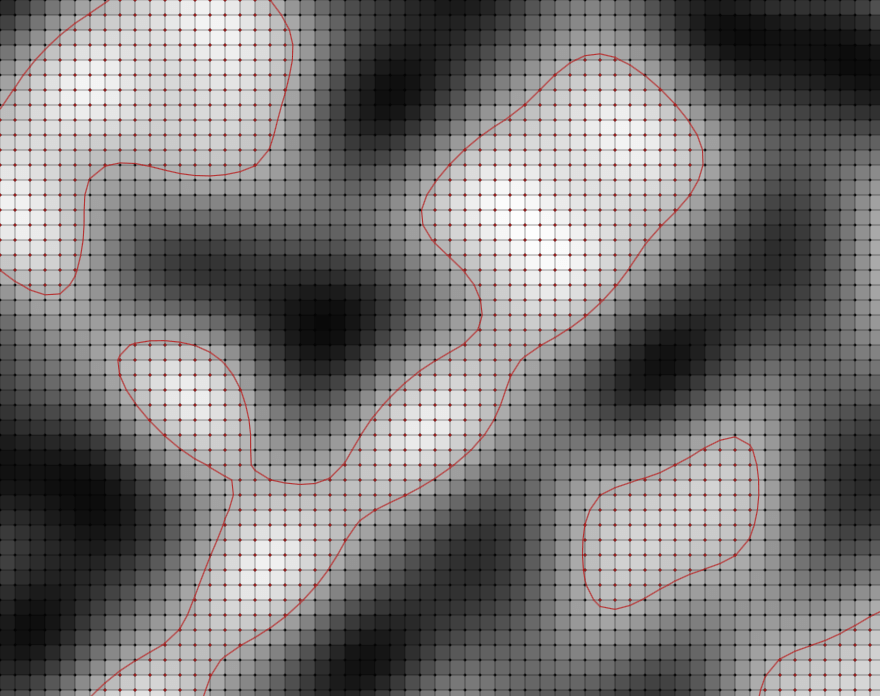
Comparison of Midpoint vs Lerp
Linear interpolation is most well known as a method of curve fitting on graphs. It is a simple, easy-to-implement, and ubiquitous method of finding a point on the line between two points. Even this font you're reading right now is rendered on the screen thanks to linear interpolation.
We won't be doing anything that fancy. Instead of taking the midpoint halfway between a corner and an edge, we will use the 'height' values associated with each position to find the boundary's precise location between the two points and use this to draw the line.
lerpPoints.ts
const lerp = (v0: number, v1: number, t: number): number => (1 - t) * v0 + t * v1;

const midPoint = (start: Vertex, end: Vertex): Vertex => {
  const [x1, y1] = start;
  const [x2, y2] = end;
  return [x1 + ((x2 - x1) / 2), y1 + ((y2 - y1) / 2)];
};

const findPoint = (
  start: Vertex,
  end: Vertex,
  grid: number[][],
  threshold: number,
  useLerp = true,
): Vertex => {
  if (useLerp) {
    const [x1, y1] = start;
    const [x2, y2] = end;
    const val1 = grid[x1][y1];
    const val2 = grid[x2][y2];
    const howFar = ((threshold - val1) / (val2 - val1));

    return [
      lerp(x1, x2, howFar),
      lerp(y1, y2, howFar),
    ];
  }
  return midPoint(start, end);
};
To explain the code above, we take our start position, work out the percent difference between the values of the start and end positions relative to the threshold, and then use lerp to tell us the point that corresponds to that percentage between the start and end positions. Although simple, it's very effective. Due to lerp, we've taken a graphical leap from the late 1900s into the 21st century.
That's not all; Despite being relatively simple, I haven't read any other tutorials on Marching squares taking the leap to generate multiple contours. However, for my reader, I like to go the extra mile. There are two ways to approach this problem: naively or intelligently.
The naive approach is re-applying what we've already written with a different threshold. This approach fails to exploit the chief advantage of the algorithm, namely that each square is independent of one another. With multiple thresholds, we don't want to re-run any processing on a square that we know will never have a line in the future.
msImproved.ts
const SPACE = 15;
const green = '#0BDA51';

const generateSquares = (grid: number[][]): Square[] => {
  const squares: Square[] = [];

  for (let x = 0; x < grid.length - 1; x += 1) {
    for (let y = 0; y < grid[x].length - 1; y += 1) {
      squares.push(getCorners(x, y));
    }
  }

  return squares;
};

export const line = (
  point1: Vertex,
  point2: Vertex,
  ctx: CanvasRenderingContext2D,
  colour = green,
  space = SPACE,
) => {
  const [x1, y1] = point1;
  const [x2, y2] = point2;
  ctx.beginPath();
  ctx.moveTo(x1 * space, y1 * space);
  ctx.lineTo(x2 * space, y2 * space);
  ctx.save();
  ctx.strokeStyle = colour;
  ctx.stroke();
  ctx.restore();
  ctx.closePath();
};

export const marchingSquaresImproved = (
  grid: number[][],
  thresholds: number[],
  ctx: CanvasRenderingContext2D,
  useLerp: boolean,
  colour = green,
) => {
  let squares: Square[] = generateSquares(grid);

  for (let i = 0; i < thresholds.length; i += 1) {
    const squaresAbove: Square[] = [];
    const threshold = thresholds[i];

    squares.forEach((square) => {
      const corners: Corner[] = square;
      const above: Corner[] = [];
      const below: Corner[] = [];

      corners.forEach((corner) => {
        const [x, y] = corner.pos;
        if (grid[x][y] >= threshold) {
          above.push(corner);
        } else {
          below.push(corner);
        }
      });

      // Case 0 & 15
      // We don't draw a line at all for these, but as each square is processed independantly
      // we can speed up the next loops by only keeping those squares which are above the current
      // threshold, thus our squares away shrinks by the number below in each loop.
      if (above.length >= 1) {
        squaresAbove.push(square);
      }
      // Cases 1, 2, 4, 7, 8, 11, 13, 14.
      // Draw line between both horizontal + vertical midpoints
      if (above.length === 1 || below.length === 1) {
        const corner = above.length === 1 ? above[0] : below[0];
        const p1: Vertex = findPoint(corner.pos, corner.vEdge, grid, threshold, useLerp);
        const p2: Vertex = findPoint(corner.pos, corner.hEdge, grid, threshold, useLerp);
        line(p1, p2, ctx, colour);
      }

      if (above.length === 2) {
        const [corner1, corner2] = above;
        const [x1, y1] = corner1.pos;
        const [x2, y2] = corner2.pos;

        if (x1 === x2 && y1 !== y2) {
          // Cases 6 & 9
          // Points horizontally aligned, draw vertical line between horiz mid points.
          const p1: Vertex = findPoint([x1, y1], corner1.hEdge, grid, threshold, useLerp);
          const p2: Vertex = findPoint([x2, y2], corner2.hEdge, grid, threshold, useLerp);
          line(p1, p2, ctx, colour);
        } else if (x1 !== x2 && y1 === y2) {
          // Cases 3 & 12
          // Points vertically aligned, draw horizontal line between horiz mid points.
          const p1: Vertex = findPoint([x1, y1], corner1.vEdge, grid, threshold, useLerp);
          const p2: Vertex = findPoint([x2, y2], corner2.vEdge, grid, threshold, useLerp);
          line(p1, p2, ctx, colour);
        } else if (x1 !== x2 && y1 !== y2) {
          // Cases 5 & 10
          // Points at a diagonal, draw line between both horizontal + vertical midpoints for both
          const p1: Vertex = findPoint([x1, y1], corner1.hEdge, grid, threshold, useLerp);
          const p2: Vertex = findPoint([x2, y2], corner2.vEdge, grid, threshold, useLerp);
          const p3: Vertex = findPoint([x1, y1], corner1.vEdge, grid, threshold, useLerp);
          const p4: Vertex = findPoint([x2, y2], corner2.hEdge, grid, threshold, useLerp);
          line(p1, p2, ctx, colour);
          line(p3, p4, ctx, colour);
        }
      }
    });
    squares = squaresAbove;
  }
};
We tackle this by pre-processing squares into a separate list, which we iterate over instead of using the grid. Because of this change, we can discard any squares below the current threshold that we know will never have a line in the future. This simple act cuts the number of squares for the next loop, speeding up processing for all subsequent loops.
In conclusion, we have developed a fast and effective base from which we can work to build maps or just pretty diagrams. Stylistically there's much to be desired. Each isoline consists of tiny 10px-long straight lines, which we could make smoother using bezier curves. Due to the length of this post, I think I'll spare you that for now. There's another form of Marching Squares called Marching Triangles that's more elegant and gives better contours that I'll tackle in another post.
I hope you've enjoyed my first tutorial on algorithms. Although this was a deviation from my norm, I've had such fun building out all of the components for this post that I'm certain to write more in this vein.